Filtering lets you view a subset of the captured information. Using the Filters view, you can restrict which owners and events are represented in the Timeline pane and some statistics-related views.
- Owners — This left tab lets you check boxes to choose the owners to include in the displayed results. You can expand interrupt and process entries to choose individual handlers and threads. Just above the list is a text field that lets you filter the owners based on matching text; the IDE updates the list as you type in keywords. Below, there are radio buttons for sorting the owners by name or by PID, as well as buttons for selecting or deselecting all list entries.
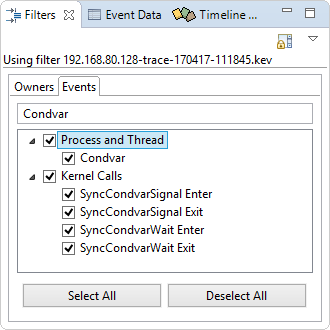
- Events — This right tab lets you select specific event classes or types to include in the results. You must expand class entries to see individual types. Like the first tab, there's a text field for filtering the list based on keywords and buttons for selecting or deselecting all list entries.
This view provides similar controls as the traceparser*() API, which allows you to parse a log file. A System Profiler filter is different from a kernel filter. This first type of filter applies to Step 4 of the kernel tracing process, so it affects what's shown in the IDE, not what's stored in the log file. Events filtered out at this stage aren't lost, unless you save the filtered data and overwrite the original file.
- Select using log — Add data for specific owners and events to the filtered set
- Deselect using log — Remove data for specific owners and events from the filtered set
- Show only using log — Replace the filtered set to show only the data for specific owners and events
- Critical Threads (owners) and Critical Events (events)
- Include event data from threads explicitly assigned to a partition. For the first option, you'll see events related to adaptive partitioning scheduling (APS), state changes, pulses and messages, and more. For the second option, you'll see only Running events. These filters let you find areas of concern in a system with APS.
- Selected (owners)
- Include event data for the owners currently selected in the Timeline pane. All events from these owners are added to the filtered set.
- State Activity (owners)
- Include event data for all threads that changed state during the trace.
- IPC Activity - All (owners) and IPC Activity - Selected Owners (owners)
- Include data from threads involved in any form of IPC (e.g., message passing, signalling). The first option filters in data for all such threads while the second one gets data for those selected in the Timeline pane and those they communicated with.
- CPU Usage - All (owners) and CPU Usage - Top 10 (owners)
- Include data from threads that consumed CPU time. The two options let you get data from all threads or the ten that consumed the most CPU time within the entire system, regardless of which processes they belong to.
When you change the filter settings, the checkboxes in the Owners and Events tabs are updated to reflect the data now included in the results set. The Timeline pane is also refreshed to show those owners defined by the active filter.
-
Switch Filter — This submenu lists all kernel event log filters available in the workspace. These filters have the same names as the log files. A filter is implicitly created for each kernel event trace that you run from the IDE.
When you select a filter, the owner and event settings defined by it are applied to the displayed trace results, causing the Filters view and Timeline pane to be refreshed.
-
Configure Filters — This menu option opens a window that lists the available filters. You can click a list entry and then the Set Active button to change filters. There are also buttons for creating a new filter, duplicating or renaming it (when one filter is selected), combining multiple filters (when you use multi-select), and deleting filters. Also, you can import and export filters, as XML files.
At the top of the popup window is a checkbox labelled Lock active filter, which controls whether the same filter gets applied to the trace results for all log files currently open. This checkbox is equivalent to the Toggle Display Lock button (
 ) shown in the view toolbar.
When you enable the locking through one of these UI controls, the other one is immediately updated.
) shown in the view toolbar.
When you enable the locking through one of these UI controls, the other one is immediately updated.