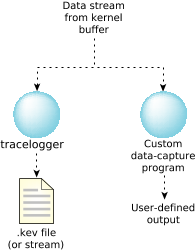
The program that captures data is the “messenger” between the instrumented kernel and the filesystem.
 Figure 1. Possible data capture configurations.
The main function of the data-capture program is to send the buffers given to it by the instrumented kernel to an output device (which may be a file or something else). In order to accomplish this function, the program must also:
- interface with the instrumented kernel
- specify data-filtering requirements the instrumented kernel will use
You must configure the instrumented kernel before logging. The instrumented kernel configuration settings include:
- buffer allocations (size)
- which events and classes of events to log (filtering)
- whether to log the events in wide mode or fast mode
We've provided tracelogger as the default data-capture utility. Although you can write your own utility, there's little need to.
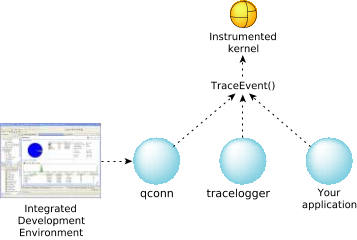
You can control the capture of data via qconn (under the control of the IDE), tracelogger (from the command line), or directly from your application. All three approaches use the TraceEvent() function to control the instrumented kernel:
 Figure 2. Controlling the capture of trace data.
For information about controlling the trace from the IDE, see the “Analyzing System Behavior” chapter of the IDE User's Guide.
Let's look first at using tracelogger, and then we'll describe how you can use TraceEvent() to control tracing from your application.
- Don't run more than one instance of tracelogger at a time. Similarly, don't run tracelogger and trace events under control of the IDE at the same time.
- In QNX Neutrino 7.0 or later, we require that the hardware underlying ClockCycles()
be synchronized across all processors on an SMP system.
If the clocks aren't synchronized, then tracelogger produces
data with inconsistent timestamps, and the IDE won't be able to load the trace file.
The IDE attempts to properly order the events in
the trace file, and this can go awry if the timestamp data is incorrect.
The traceprinter utility doesn't have any issues with such traces because it doesn't attempt to reorder the data and interpret it; it simply dumps the contents of each event.