Valgrind Massif takes detailed heap snapshots to record dynamic memory allocation by program region. The IDE displays this memory breakdown so you can easily find space leaks, which occur when the program doesn't free unneeded memory.
-
Click the Edit button (
 )
on the right of the Launch Configuration dropdown.
)
on the right of the Launch Configuration dropdown.
-
In the launch bar, click the Check button
(
 ).
).
The IDE switches to the QNX Analysis perspective. If necessary, the IDE first builds the binary before uploading it to the target. To analyze the application, the IDE instructs Valgrind to execute the uploaded binary with Massif instrumentation. Then, it creates a session for storing the Valgrind results; this new session is displayed in the Analysis Sessions view. When the program terminates, Valgrind writes the results to a log file, which the IDE copies into the directory for the new session.
The memory measurements taken at each snapshot are graphed in the Heap Chart window
(for more information, see “Analyzing heap memory usage with Valgrind Massif”).
The Valgrind view, which is displayed at the bottom, presents the heap snapshot data in a table.
The rows for detailed snapshots are indicated with the heap tree icon
(![]() ). Double-clicking in
one of these rows displays the heap trees for all detailed snapshots, with the entries for the selected snapshot expanded.
). Double-clicking in
one of these rows displays the heap trees for all detailed snapshots, with the entries for the selected snapshot expanded.
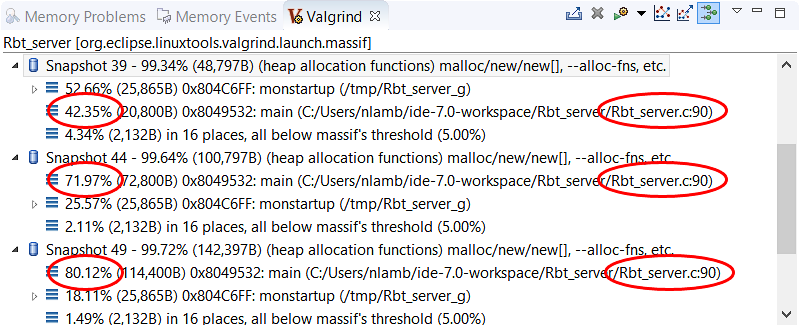
The heap trees should show location information for functions in shared libraries. If you don't see this information, you must manually configure the loading of debug symbols.
Here, the program is accumulating a lot of heap memory at one particular allocation point in main(). You would want to review the surrounding code to see if any blocks don't need to be kept in memory for as long. Whether a block is needed depends on your program logic; Massif shows you the evolution of memory usage but you must examine your code closely to learn which blocks can be deallocated.