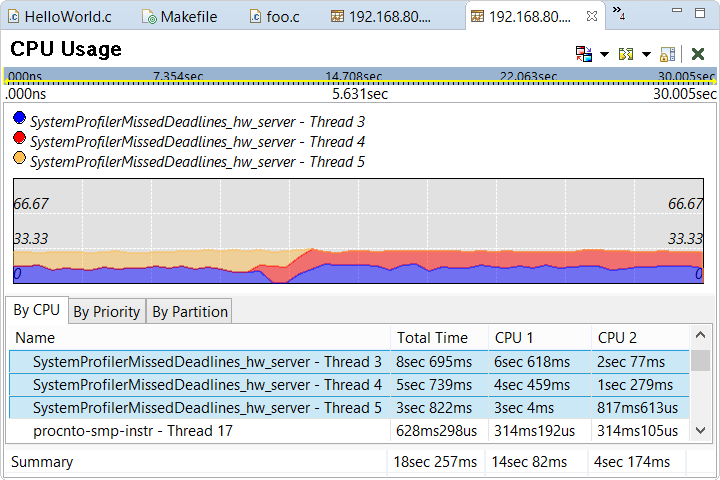
A key step in optimizing embedded systems is locating sources of high CPU usage. The System Profiler results show you per-process and per-thread CPU consumption over some or all of the trace period so you can spot peaks in the processor loads.
In the Summary pane, the statistics for CPU time breakdown give you an idea of how efficiently your QNX target is performing, by showing you the amount of idle time and the ratio of user time to system time. They also let you spot interrupt flooding, which occurs when interrupt time isn't as low as you expect based on your system design. A higher interrupt time could mean faulty hardware, a bad driver, or too many applications being profiled at the same time.
To find periods of high CPU usage, you can start by looking for peaks in the Process & Thread Activity bar graph. These peaks officially indicate high numbers of events at particular times, which often happen when one or more applications are using the CPU heavily. If you run the kernel event trace during an important operational phase, such as system startup or just after a certain application is launched, this graph can tell you when the embedded system is heavily loaded.

After learning which threads are heavy CPU consumers, you can profile the corresponding applications to see which functions are called most often and have the longest runtimes.